How Markets And The Media Have Overhyped Coronavirus

By Josh Owens
In my last article, Are Oil Markets Overreacting To The Coronavirus?, I warned of the power of media hype when it comes to epidemics. The human brain has a tendency to mix up the severity of an outcome with how likely that thing is to happen. Just like our fear of terrorism or shark attacks, when it comes to epidemics we are incredibly poor judges of how much of a danger they really pose.
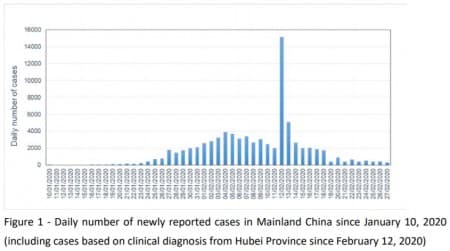
Our intensely interconnected societies and sensationalist media mean that this failure of judgment can translate into mass hysteria and fear in the markets that can have a tangible impact on the world economy. Oil prices have collapsed, stock markets have fallen by the largest amount since the 2008 financial crisis and the Dow Jones saw its largest single-day points drop in history. All of this has come from the spread of the coronavirus from China to South Korea, Italy, Iran, and Japan. But as this spread continues there is one key factor that market observers appear to be missing, highlighted by the below chart.

This is an epidemic curve showing the number of new cases per day in China (the world’s second-largest economy and the world’s largest importer of goods). It appears that China is in the process of successfully containing the coronavirus and, for that reason, has already begun to reboot its economy.
The large jump in the middle of the above graph was caused by China changing its recording method from positive test cases to clinical diagnosis. The trend can perhaps be seen more clearly in the Guangdong outbreak in the curve below.

You can follow more epidemic curves updated regularly on Hong Kong’s Centre for Health Protection, including the more recent and smaller outbreaks beyond China’s borders. All of the Chinese data suggests that the epidemic is coming under control there.
Here is a graph of containership congestion levels in the Outer Pearl River Delta:

China is getting back to work. And you can be sure that the Chinese government will be doing everything in its power to stimulate growth.
Here are some other key indicators that show the same thing:

But these are generally not the statistics or the graphs reported by the media. Instead, they report cumulative data and crude numbers out of context.

These cumulative graphs suggest that coronavirus deaths and cases are increasing and therefore the epidemic is getting worse. Of course, in a cumulative graph, the cases will only ever go up or plateau.

This graph, which is far more relevant, shows a general downward trend in global new confirmed cases per day and an increase in new recovered cases. This data would suggest that containing the coronavirus is very much a possibility and if governments continue to follow good practice the new outbreaks can be controlled without impacting the economy too severely.
In fact, the largest threat to the markets at the moment is not an epidemic of disease but an epidemic of hysteria. Governments and medical institutions are reacting, as they should, to prevent a worst-case scenario. But for societies and markets to react in the same way is neither logical nor healthy.
For example, the WHO recently upgraded the global risk of the coronavirus outbreak to ‘very high’, a fact that spread across media outlets like wildfire. At the same time, the head of the WHO stressed that the biggest challenges to overcome were fear and misinformation. It is this fear and misinformation that is driving a huge portion of the negative sentiment in global markets.
Another way that media spreads this fear is by reporting the number of deaths and cases without context. Take the numbers below.

Yet, when compared to the global annual mortality of other diseases, the number of total deaths is relatively insignificant.
Measles: 140,000 deaths
Influenza: 650,000 deaths
Tuberculosis: 1.5 million deaths
Infectious gastroenteritis: 1.8 million deaths
Imagine a world in which every death from the flu was reported on the front page of every media outlet. You might be surprised, for example, to find out that in the U.S. 105 children have died from the flu so far in 2020 – the second-highest number of deaths at this time of year since records began in 2004.
Another piece of relevant data that is frequently excluded from articles about the coronavirus is the age and health of coronavirus victims. With the death rate for an infected individual aged 50 or lower under 1% and the death rate of an infected individual without a pre-existing condition also below 1%.


A vital point to understand when it comes to public health measures designed to contain an epidemic is that it is always a trade-off between the deaths caused by the epidemic and the deaths caused by economic stagnation. Poverty is the single largest determinant of health, and economic growth is the single most powerful instrument for reducing poverty. This is not a zero-sum game and it will be a calculation that the Chinese government must make as its population returns to work.
It is possible that stock markets were in a bubble at the start of 2019 and the coronavirus was the black swan event necessary to bring it all crashing down to earth. As for oil markets, there is plenty of bearish news at the moment, with an oil supply glut, Russia angling to leave the OPEC+ deal and Libyan oil production poised to come back online. Chinese demand has undoubtedly fallen in Q1 and everything from refinery runs to imports have been hit extremely hard. An oil price crash was entirely justified then. But the data doesn’t suggest that the coronavirus is escalating. The data suggest China has already started coming back online. The question is, when will that data begin to show in the markets?
Source: Oil Price


